This January 2009 help sheet gives information on how to obtain:
PROBABILITIES AND INVERSE PROBABILITIES
We consider the standard normal distribution as an example.
Let X be random variable, x be a value of the random variable, and p be a probability. Then:

T-DISTRIBUTION PROBABILITIES AND INVERSE-PROBABILITIES
These are the most commonly-used probabilities in statistical
analysis of economics data.
These use the TDIST and TINV functions.
TDIST gives the probability of being in the right tail i.e. Pr(X
> x), or of being in both tails i.e. Pr(|X| > x).
TINV considers the inverse of the probability of being in both tails.
1. Find Pr(X <= 1.9) when x is t-distributed with 9 degrees of freedom.
This is 1 - Pr(X > 1.9) where Excel function TDIST gives Pr(X > 1.9).
Choose Formulas Tab |
Function Library Group | More Functions | Statistical | TDIST.
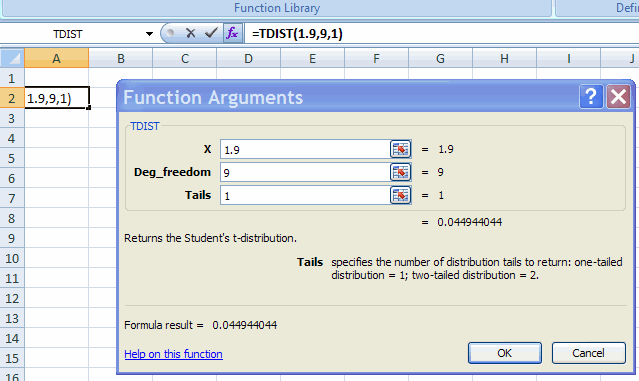
Fill in the Function Arguments Tab:

This gives result that Pr(X > 1.9) = 0.0449.
So Pr(X <= 1.9) = 1 - 0.0449 = 0.9551.
Much simpler is to directly type in the cell = 1 - TDIST(1.9, 9, 2)
and hit
<enter>.

2. Find the value x* such that Pr(X <= x*) = 0.9 when x is
t-distributed with 9 degrees of freedom.
This is the same value as that for which Pr(|X| >= x*) = 0.2.
(Since there is probability 0.1 in the right tail and probability
0.1 in the left tail).
Choose Formulas Tab |
Function Library Group | More Functions | Statistical | TINV.
Fill in the Function Arguments Tab:
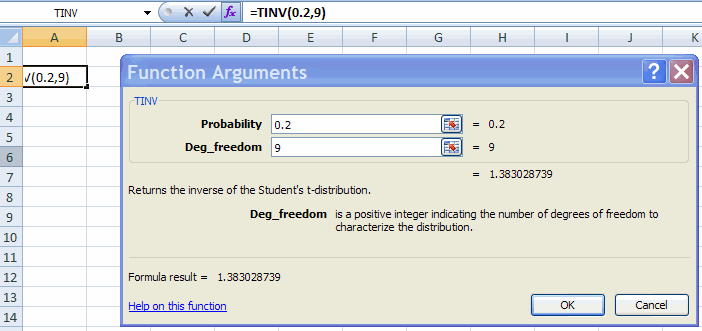
This gives result that Pr(|X| > 1.383) = 0.2.
So Pr(X <= 1.383) = 0.9.

STANDARD NORMAL PROBABILITIES AND INVERSE-PROBABILITIES
These are less used than the t-distribution in statistical analysis of
economics data.
These use the NORMDIST and NORMINV functions.
IMPORTANT: The format and
results of these commands differ from those for the
normal.
NORMDIST directly gives the cumulative distribution function i.e. Pr(X
<= x), whereas TDIST instead gives the right tail, i.e. Pr(X > x)
!!
NORMINV considers the inverse of the probability of being in both
tails, similar to TINV.
1. Find Pr(X <= 1.9) when x is standard normal (i.e. normal with mean=0 and variance=1).
Choose Formulas Tab |
Function Library Group | More Functions | Statistical | NORMDIST.
Fill in the Function Arguments Tab with Z value of 1.9.
This gives result that Pr(X <= 1.9) = 0.9713.
Much simpler is to directly type in the cell =NORMSDIST(1.9) and hit <enter> to get Pr(X <= 1.9) = 0.9713.
2. Find the value x* such that Pr(X <= x*) = 0.9 when x is standard normal.
Choose Formulas Tab |
Function Library Group | More Functions | Statistical | NORMDIST.
Fill in the Function Arguments Tab with probability value of 0.9.
This gives result that x* = 1.2816, i.e. Pr(X <= 1.2816) = 0.9.
Much simpler is to directly type in the cell = NORMSINV(0.9)
and hit
<enter> to get x* = 1.2816.
The standard normal sets the mean to 0 and standard deviation to 1.
Here we consider the normal distribution with other values for the mean
µ and standard devation σ.
THE functions used are NORMDIST and NORMINV.
1. Find Pr(X <= 9) when x is normal with mean µ =8
and
variance
4.8.
Here standard deviation = σ = sqrt(4.8) = 2.1909.
Choose Formulas Tab |
Function Library Group | More Functions | Statistical | NORMDIST.
Fill in the Function Arguments Tab
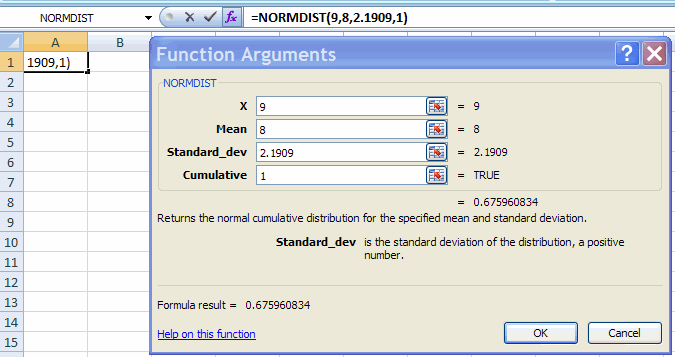
This gives result that Pr(X > 9) = 0.67596 for X normally distributed wuith mean 8 and variance 4.8.
Much simpler is to directly type in the cell = NORMDIST(9, 8, 2.1909, 1) and hit <enter>.
2. Find the value x* such that Pr(X <= x*) = 0.9 when x is normal with mean µ =8 and variance 4.8, so standard deviation = σ = sqrt(4.8) = 2.1909.
Choose Formulas Tab |
Function Library Group | More Functions | Statistical | NORMINV.
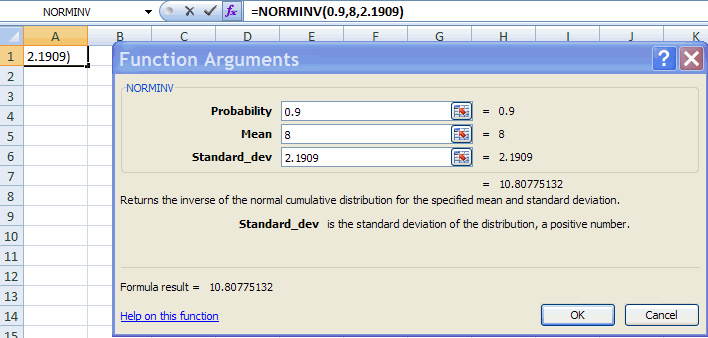
Fill in the Function Arguments Tab:
| probability | 0.9 |
| mean | 8 |
| standard_dev | 2.1909 |
This gives result x* = 10.8077. i.e. Pr(X < 10.8077) = 0.9 when x is normal with mean µ =8 and variance 4.8.
Much simpler is to directly type in the cell = NORMINV(0.9, 8, 2.1909) and hit <enter>.
OTHER DISTRIBUTIONS
Excel provides probabilities for the following distributions (in
Formulas Tab |
Function Library Group | More Functions | Statistical), presented in
approximate
order of most commonly used in the analysis of economics data:
RANDOM NUMBER GENERATION
It can be useful to generates a random sample of observations from a specified distribution, such as the standard normal.
Use Data Tab | Analysis Group | Data Analysis.
This permits generation from
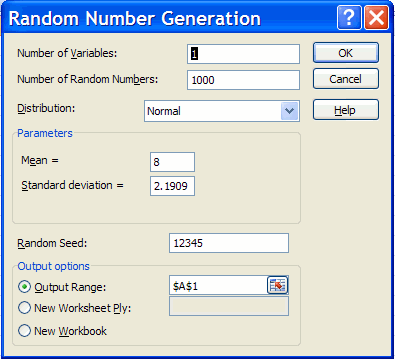
Generate 1000 values of x where x is normal with mean mu = 8 and variance 4.8, so standard deviation = sigma = sqrt(4.8) = 2.1909.
Choose Data | Analysis | Data Analysis | Random Number Generation.
Then in the Random Number Generation dialog box fill in:
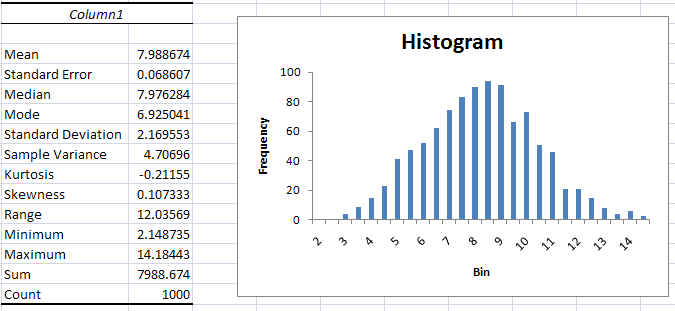
The 1,000 random draws have sample mean close to 8, sample variance
close to 4.8, and histogram that is close to a bell-shaped curve.
For further information on how to use Excel
see
http://cameron.econ.ucdavis.edu/excel/excel.html