DATA INPUT
First enter the following gasoline price data (Cents per gallon) in cells
A1:A10 in the spreadsheet
117.9, 119.9, 115.9, 121.9, 121.9, 118.9, 118.9, 123.9, 125.9, 113.9.
For simplicity we will not put a title to the data but in practice it is
always best to so. [One can do this by insert a row at row 1 - at cell A1
right-click and choose insert and entire row or choose Inset | Rows - and
type into this row Gasoline price.)
So the data are in cells A1:A10.
SUMMARY STATISTICS USING DATA ANALYSIS
To easily obtain a range of descriptive statistics
A complete listing of Excel output is given at the end.
Key output includes:
| Mean | 119.9 | ybar = the sample mean. |
| Standard error | 1.145038 | s/sqrt(n) = the estimated standard deviation of the sample mean |
| Standard deviation | 3.620927 | s = the estimated standard deviation of y |
| Variance | 13.11111 | s-squared = the estimated variance of y = Sum of (y_i - ybar)^2 |
| Count | 10 | n = sample size |
| Confidence level (95%) | 2.590257 | t(.025;n-1)*s/sqrt(n) |
The mean is the simple average of the observations and is the standard
estimate of the center of the data. (Other estimates are the median and the
mode).
The standard deviation is the standard estimate of the variability of the
data.
The standard error and the confidence interval are used for statistical inference
on the population mean and are discussed in Excel: Statistical
Inference for univariate data
ADDITIONAL SUMMARY STATISTICS USING DATA ANALYSIS
The standard output gives Mean, Standard error, Median, Mean, Standard
deviation, Variance, Kurtosis, Skewness, Range, Maximum, Minimum,
Sum, and Count.
Additionally one can obtain the k-th largest and k-th smallest values by checking the appropriate column and setting k. For examples with 43 observations one might choose the 11th smallest and 11th largest to obtain approximate estimates of the lower quartile and upper quartile. (Easier is to separately use the Quartile or Percentile Commands).
And finally one can find the half-width of a confidence interval for the
population mean by selecting Confidence level for mean. This is explained
in Excel: Statistical Inference for univariate data
STATISTICS BY INDIVIDUAL COMMAND
The descriptive statistics can be obtained separately by individual commands.
In addition one can find many more commands than appears in summary statistics.
Assume the data is in cells A1:A10. To obtain the sample mean and
report it in, say, cell F1
either type in cell F1 the text =AVERAGE(A1:A10)
or do the following:
The following commands produce the same output as the default output for Tools | Data Analysis
Mean: =AVERAGE(A1:A10)
Standard error: =STDEV(A1:A10)/SQRT(COUNT(A1:A10))
Median: =MEDIAN(A1:A10)
Mean: =MODE(A1:A10)
Standard deviation: =STDEV(A1:A10)
Variance: =VAR(A1:A10)
Kurtosis: =KURT(A1:A10)
Skewness: =SKEW(A1:A10)
Range: =MAX(A1:A10)-MIN(A1:A10)
Maximum: =MAX(A1:A10)
Minimum: =MIN(A1:A10)
Sum: =SUM(A1:A10)
Count: =COUNT(A1:A10)
The complete Excel 2000 statistical commands are:
AVEDEV, AVERAGE, AVERAGEA,
BETADIST, BETAINV, BINOMDIST,
CHIDIST, CHIINV, CHITEST, CONFIDENCE, CORREL, COUNTM COUNTA, COUNTBLANK, COUNTIF,
COVAR, CRITBINOM,
DEVSQ,
EXPONDIST,
FDIST, FINV, FISHER, FISHERINV, FORECAST, FREQUENCY, FTEST,
GAMMAINV, GAMMLN, GEOMEAN, GROWTH,
HARMEAN, HYPGEOMDIST,
INTERCEPT,
KURT,
LARGE, LINEST, LOGEST, LOGINV, LOGNORMDIST,
MAX, MAXA, MEDIAN, MIN, MINA, MODE,
NEGBINOMDIST, NORMDIST, NORMINV, NORMSDIST, NORMSINV,
PEARSON, PERCENTILE, PRECENTRANK, PERMUT, POISSON, PROB,
QUARTILE,
RANK, RSQ,
SKEW, SLOPE, SMALL, STANDARDIZE, STDEV, STDEVA, STDEVP, STDEVPA, STEYX,
TDIST, TINV, TREND, TRIMMEAN, TTEST,
VAR, VARA, VARP, VARPA,
WEIBULL,
ZTEST.
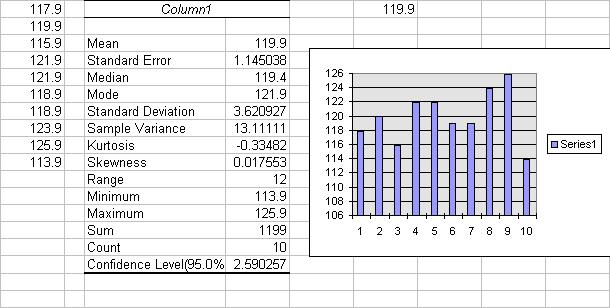
OUTPUT
Excel Output for this example (including a crude graph), including the
confidence level option is:
Much of the output is descriptive.
The main statistical components are to form confidence intervals and hypothesis
tests, discussed in a separate handout: Excel: Statistical
Inference for univariate data
For further information on how to use Excel go to
http://www.econ.ucdavis.edu/faculty/cameron