Other ways to do two-variable regression are discussed
in Excel: Two-way Plots in the section on
Add a trendline and
in Excel: Two Variable Regression using Excel
Functions.
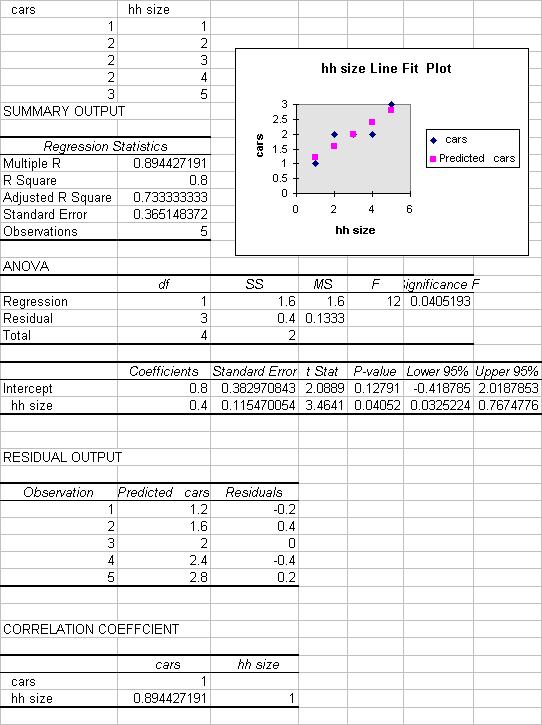
INPUT DATA
The data used are in number of cars per household (Y) and household
size (X).
The spreadsheet cells A1:B6 should look like:
| cars | hh size |
| 1 | 1 |
| 2 | 2 |
| 2 | 3 |
| 2 | 4 |
| 3 | 5 |
RUN THE REGRESSION
The population regression model is
y = b1 + b2*x + u
where the error term u has mean 0 and variance sigma-squared.
We wish to estimate the regression line
y = b1 + b2*x
Do this by Tools / Data Analysis / Regression.
A relatively simple form of the command (with labels and line plot)
is
| Input Y Range | a1:a6 |
| Input X Range | b1:b6 |
| Labels | Tick |
| Output range | a8 |
| Line Plot | Tick |
and then hit OK.
REGRESSION SUMMARY OUTPUT
There is quite a lot of regression output produced. See end for all the output.
Regression statistics
| Explanation | ||
| Multiple R | 0.894427 | R = square root of R^2 |
| R Square | 0.8 | R^2 = coefficient of determination |
| Adjusted R Square | 0.733333 | Adjusted R^2 used if more than one x variable |
| Standard Error | 0.365148 | This is the sample estimate of the st. dev. of the error u |
| Observations | 5 | Number of observations used in the regression (n) |
Anova
| df | SS | MS | F | Signifiance F | |
| Regression | 1 | 1.6 | 1.6 | 12 | 0.04519 |
| Residual | 3 | 0.4 | 0.133333 | ||
| Total | 4 | 2.0 |
The regression output of most interest is the following
| Coefficient | St. error | t Stat | P-value | Lower 95% | Upper 95% | |
| Intercept | 0.8 | 0.38297 | 2.089 | 0.1279 | -0.4188 | 2.0188 |
| hh size | 0.4 | 0.11547 | 3.464 | 0.0405 | 0.0325 | 0.7675 |
INTERPRET THE REGRESSION SUMMARY OUTPUT
Let b1 denote the population coefficient of the intercept and b2 the
population coefficient of hh size.
The column "Coefficient" gives the least squares estimates of b1 and
b2.
Thus the fitted line is
y = 0.8 + 0.4*x
or
cars = 0.8 + 0.4*hhsize
This is the key output we are interested in.
FITTED VALUES AND RESIDUALS FROM REGRESSION LINE
Fitted values and residuals from the regression line
| y = cars | x = hh size | yhat = 0.8+0.4*x | e = y - yhat |
| 1 | 1 | 1.2 | -.2 |
| 2 | 2 | 1.6 | 0.4 |
| 2 | 3 | 2.0 | 0.0 |
| 2 | 4 | 2.4 | -.4 |
| 3 | 5 | 2.8 | 0.2 |
PREDICTED VALUE OF Y GIVEN X = 4
yhat = b1 + b2*x = 0.8 + 0.4*4 = 2.4.
This is also the predicted value of the conditional mean of y given
x=4.
COMPLETE EXCEL OUTPUT FOR THIS EXERCISE
This output is discussed in much greater detail in: Excel:
Statistical Inference for Two-Variable Regression
For further information on how to use Excel go to
http://www.econ.ucdavis.edu/faculty/cameron