EXCEL 2007: Two-Variable Correlation
A. Colin Cameron, Dept. of Economics, Univ. of
Calif.
- Davis
This January 2009 help sheet gives information on
- Correlation coefficient.
- Calculation using the Data Analysis Add-in.
- Calculation using the CORREL function.
- Covariances.
CORRELATION COEFFICIENT
The correlation coefficient between two series, say x and y,
equals
Covariance(x,y) / [Sqrt(Variance(x)) * Sqrt(Variance(y))]
where
- Covariance(x,y) is the sample covariance between x and y:
(1/(n-1)) × Σ i (xi - xbar)(yi
- ybar)
- Variance(x) is the sample variance of x: (1/(n-1)) × Σ
i (xi - xbar)2
- Variance(x) is the sample variance of y: (1/(n-1)) × Σ
i (yi - ybar)2
CALCULATION USING THE DATA ANALYSIS ADD-IN
This requires the Data Analysis Add-in: see Excel 2007: Access and Activating the
Data Analysis Add-in
The data used are in carsdata.xls
We consider only two series, but we could do the same for more than two
series.
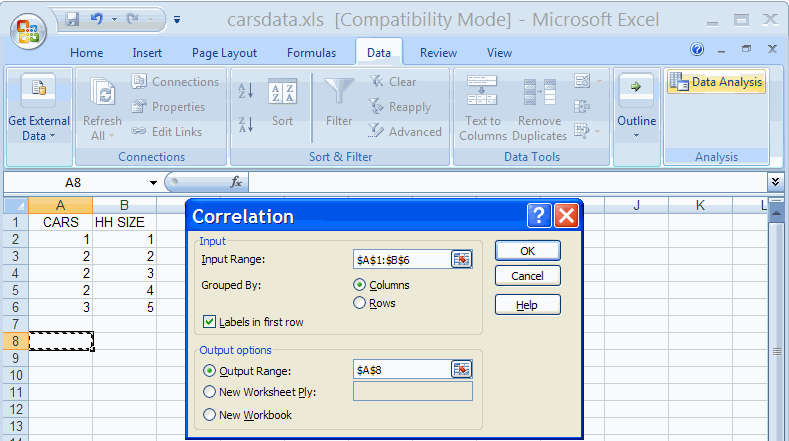
- In the Data Group select the Data Analysis Add-in
- Select Correlation
- Fill out the Correlation dialog box as below

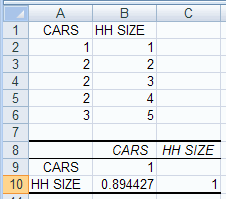
Hit enter yields

The correlation coefficient is 0.894427.
This can be extended to several series.
For example if there are data in columns A, B, C, D and E then the
array chosen is A1:E6 and produces a 5 x 5 table of correlations.
CALCULATION USING THE CORREL FUNCTION
This does not require the Data Analysis Add-in
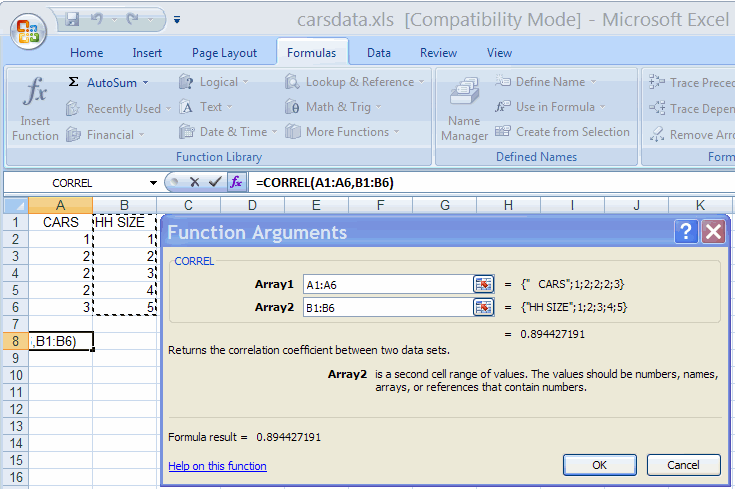
- Click on the cell you want result to appear on.
- On the Formula Tab select the Function Library group and More
Functions and Statistical
- Select Correlation and fill out the dialog box as below

Alternatively directly type = CORREL(A1:A6,B1:B6) which
yields
0.894427.
Note that Excel dropped the first row (or labesl).
= CORREL(A2:A6,B2:B6) yields the same result.
COVARIANCE
This is obtained in a similar way to correlation.
- We can use Data Analysis Add-in and Covariance
- We can use function CORREL
IFor example, = COVAR(A1:A6,B1:B6) yields
0.8.
For further information on how to use Excel go to
http://cameron.econ.ucdavis.edu/excel/excel.html


