REGRESSION USING EXCEL FUNCTIONS INTERCEPT, SLOPE, RSQ, STEYX and
FORECAST
The population regression model is: y = β1
+ β2 x + u
We wish to estimate the regression line: y = b1 + b2 x
The individual functions INTERCEPT, SLOPE, RSQ, STEYX and FORECAST can be used to get key results for two-variable regression

REGRESSION USING EXCEL FUNCTION LINEST
The individual function LINEST can be used to get regression
output similar to that
several forecasts from a two-variable regression.
This is tricky to use.
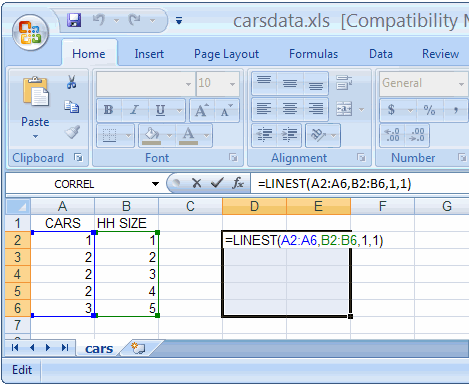
The formula leads to output in an array (with five rows and two columns
(as here there are two regressors), so we need to use an array formula.
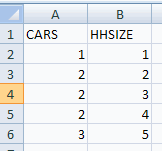
We consider an example where output is placed in the array D2:E6.
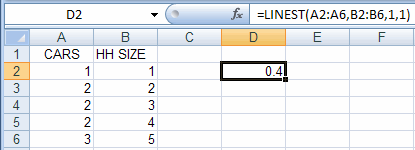
First in cell D2 enter the function LINEST(A2:A6,B2:B6,1,1).

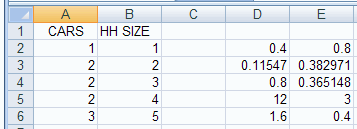
In particular, the fitted regression is
CARS = 0.4 + 0.8 HH SIZE with R2 = 0.8
The estimated coefficients have standard errors of, respectively,
0.11547 and 0.382971.
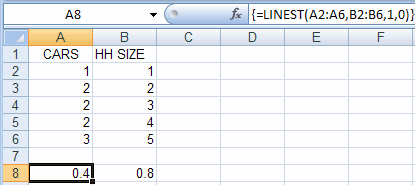
To get just the coefficients give the LINEST command with the last
entry
0 rather than 1, ie. LINEST(A2:A6,B2:B6,1,0),
and then highlight cells A8:B8, say, hit F2 key, and hit
CTRL-SHIFT-ENTER.
LINEST can be extended to multiple regression (more than an
intercept
and one regressor).
Then the first two rows of output are extended to number of columns
equals number of regressors (including constant)
and the last three rows are the same as earlier.
The LOGEST function is the same as the LINEST function, except that an
exponential relationship is estimated rather than a linear relationship.
PREDICTION USING EXCEL FUNCTION TREND
The individual function TREND can be used to get several
forecasts
from a two-variable regression.
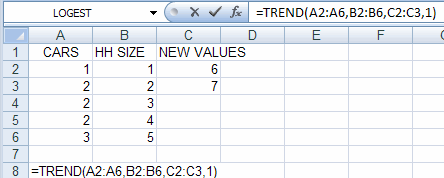
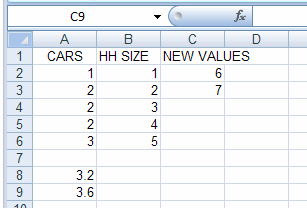
This is tricky to use:
Function TREND can be extended to multiple regression (more than an
intercept
and one regressor).
For further information on how to use Excel go to
http://cameron.econ.ucdavis.edu/excel/excel.html