DESCRIPTIVE STATISTICS USING DATA ANALYSIS ADD-IN
We consider the following gasoline price data (cents per gallon)
These data are in gasolinepricedata.csv
[Alternatively type in cells A1:A10 the ten values
117.9, 119.9, 115.9, 121.9, 121.9, 118.9, 118.9, 123.9, 125.9, 113.9.
and then insert a header GAS PRICE in new row 1] .
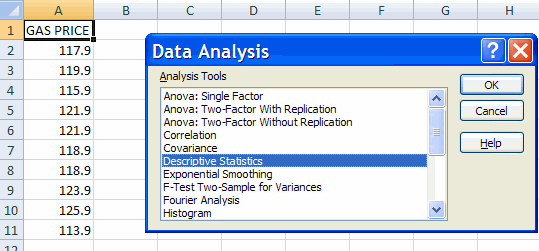
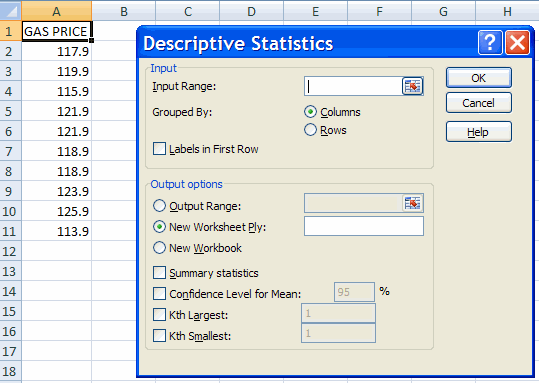
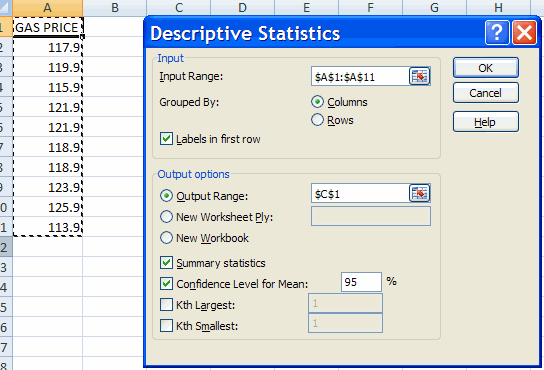
To obtain various descriptive statistics


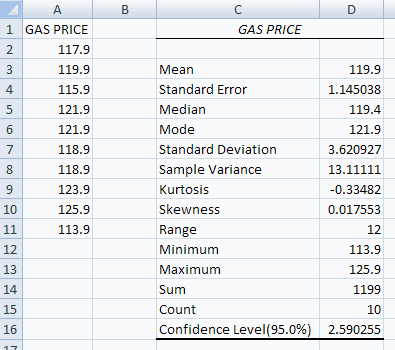
| Mean | 119.9 | ybar = the sample mean. |
| Standard error | 1.145038 | s/sqrt(n) = the estimated standard deviation of the sample mean |
| Standard deviation | 3.620927 | s = the estimated standard deviation of y |
| Variance | 13.11111 | s-squared = the estimated variance of y = Sum of (y_i - ybar)^2 |
| Count | 10 | n = sample size |
| Confidence level (95%) | 2.590255 | t(.025;n-1)*s/sqrt(n) |
The mean is the simple average of the observations and is the
standard estimate of the center of the data. (Other estimates are the
median and the
mode).
The standard deviation is the standard estimate of the variability of
the
data.
The standard error and the confidence level are used for statistical
inference
on the population mean and are discussed in Excel: Statistical
Inference for univariate data
ADDITIONAL SUMMARY STATISTICS USING DATA ANALYSIS
The standard output gives Mean, Standard error, Median, Mean,
Standard deviation, Variance, Kurtosis, Skewness, Range, Maximum,
Minimum,
Sum, and Count.
Additionally one can obtain the k-th largest and k-th smallest
values by
checking the appropriate column and setting k.
For example, with 43 observations
one might choose the 11th smallest and 11th largest to obtain
approximate
estimates of the lower quartile and upper quartile. (Easier is to
separately
use the Quartile or Percentile Commands).
STATISTICS BY INDIVIDUAL COMMAND
The descriptive statistics can be obtained separately by individual
commands.
In addition one can find many more commands than appears in summary
statistics.
Assume the data is in cells A2:A11. To obtain the sample mean
and
report it in, say, cell A13
either type in cell A13 the text = AVERAGE(A2:A11)
or do the following:
The following commands produce the same output as the default output for Tools | Data Analysis
The complete Excel 2007 statistical commands (in Formulas Tab |
Function Library Group | More Functions | Statistical) are:
For further information on how to use Excel go to
http://cameron.econ.ucdavis.edu/excel/excel.html