EXCEL 2007: Two-way Plots with Nonlinear Trend
A. Colin Cameron, Dept. of Economics, Univ. of
Calif.
- Davis
This January 2009 help sheet gives information on
- Adding a nonlinear trend (exponential, logarithmic, polynomial)
to a two-way scatter plot.
SPECIFIC TRENDLINES FOR A SCATTERPLOT
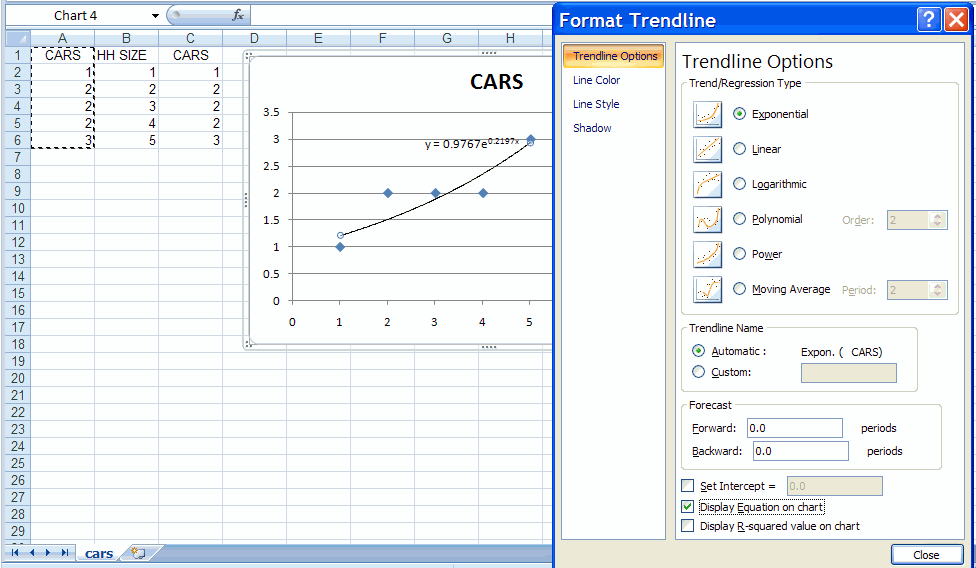
We first create a scatterplot for the cars data in carsdata.xls
For details see Excel 2007: Two-way Plots
Specifically
- Copy column A to column C (we need HH SIZE first then CARS for an
XY scatter plot).
- Highlight columns B and C.
- Choose the Insert Tab and the Charts Group and Scatter and
then Scatter Only with markers
- Click on a point within the chart so that all the point on the
chart
are highlighted (this is tricky)
- Right-click to get options including Add Trendline
Several options are given.
To obtain an exponential trend check this option, as well as Display
equation on chart.

The various options are
- Logarithmic: y = c + b*ln(x) + u
This is a linear-log relationship.
- Exponential: y = c*exp(bx)*u
This is a log-linear relationship since taking logs gives ln(y)
= ln(a) + b*ln(x) + ln(u)
- Power: y = a*(x^b)*u
This is a log-log relationship since taking logs gives ln(y) = ln(a)
+ b*ln(x) + ln(u)
- Polynomial: y = a + b*x + c*x^2 + d*x^4 + .... + u
This is for example a quadratic relationship if the poynomial is of
order 2.
- Moving average.
This is generally only useful for time series data.
For further information on how to use Excel go to
http://cameron.econ.ucdavis.edu/excel/excel.html

